

How to Measure Event Success: Metrics That Matter
Search for a command to run...
No comments yet. Be the first to comment.
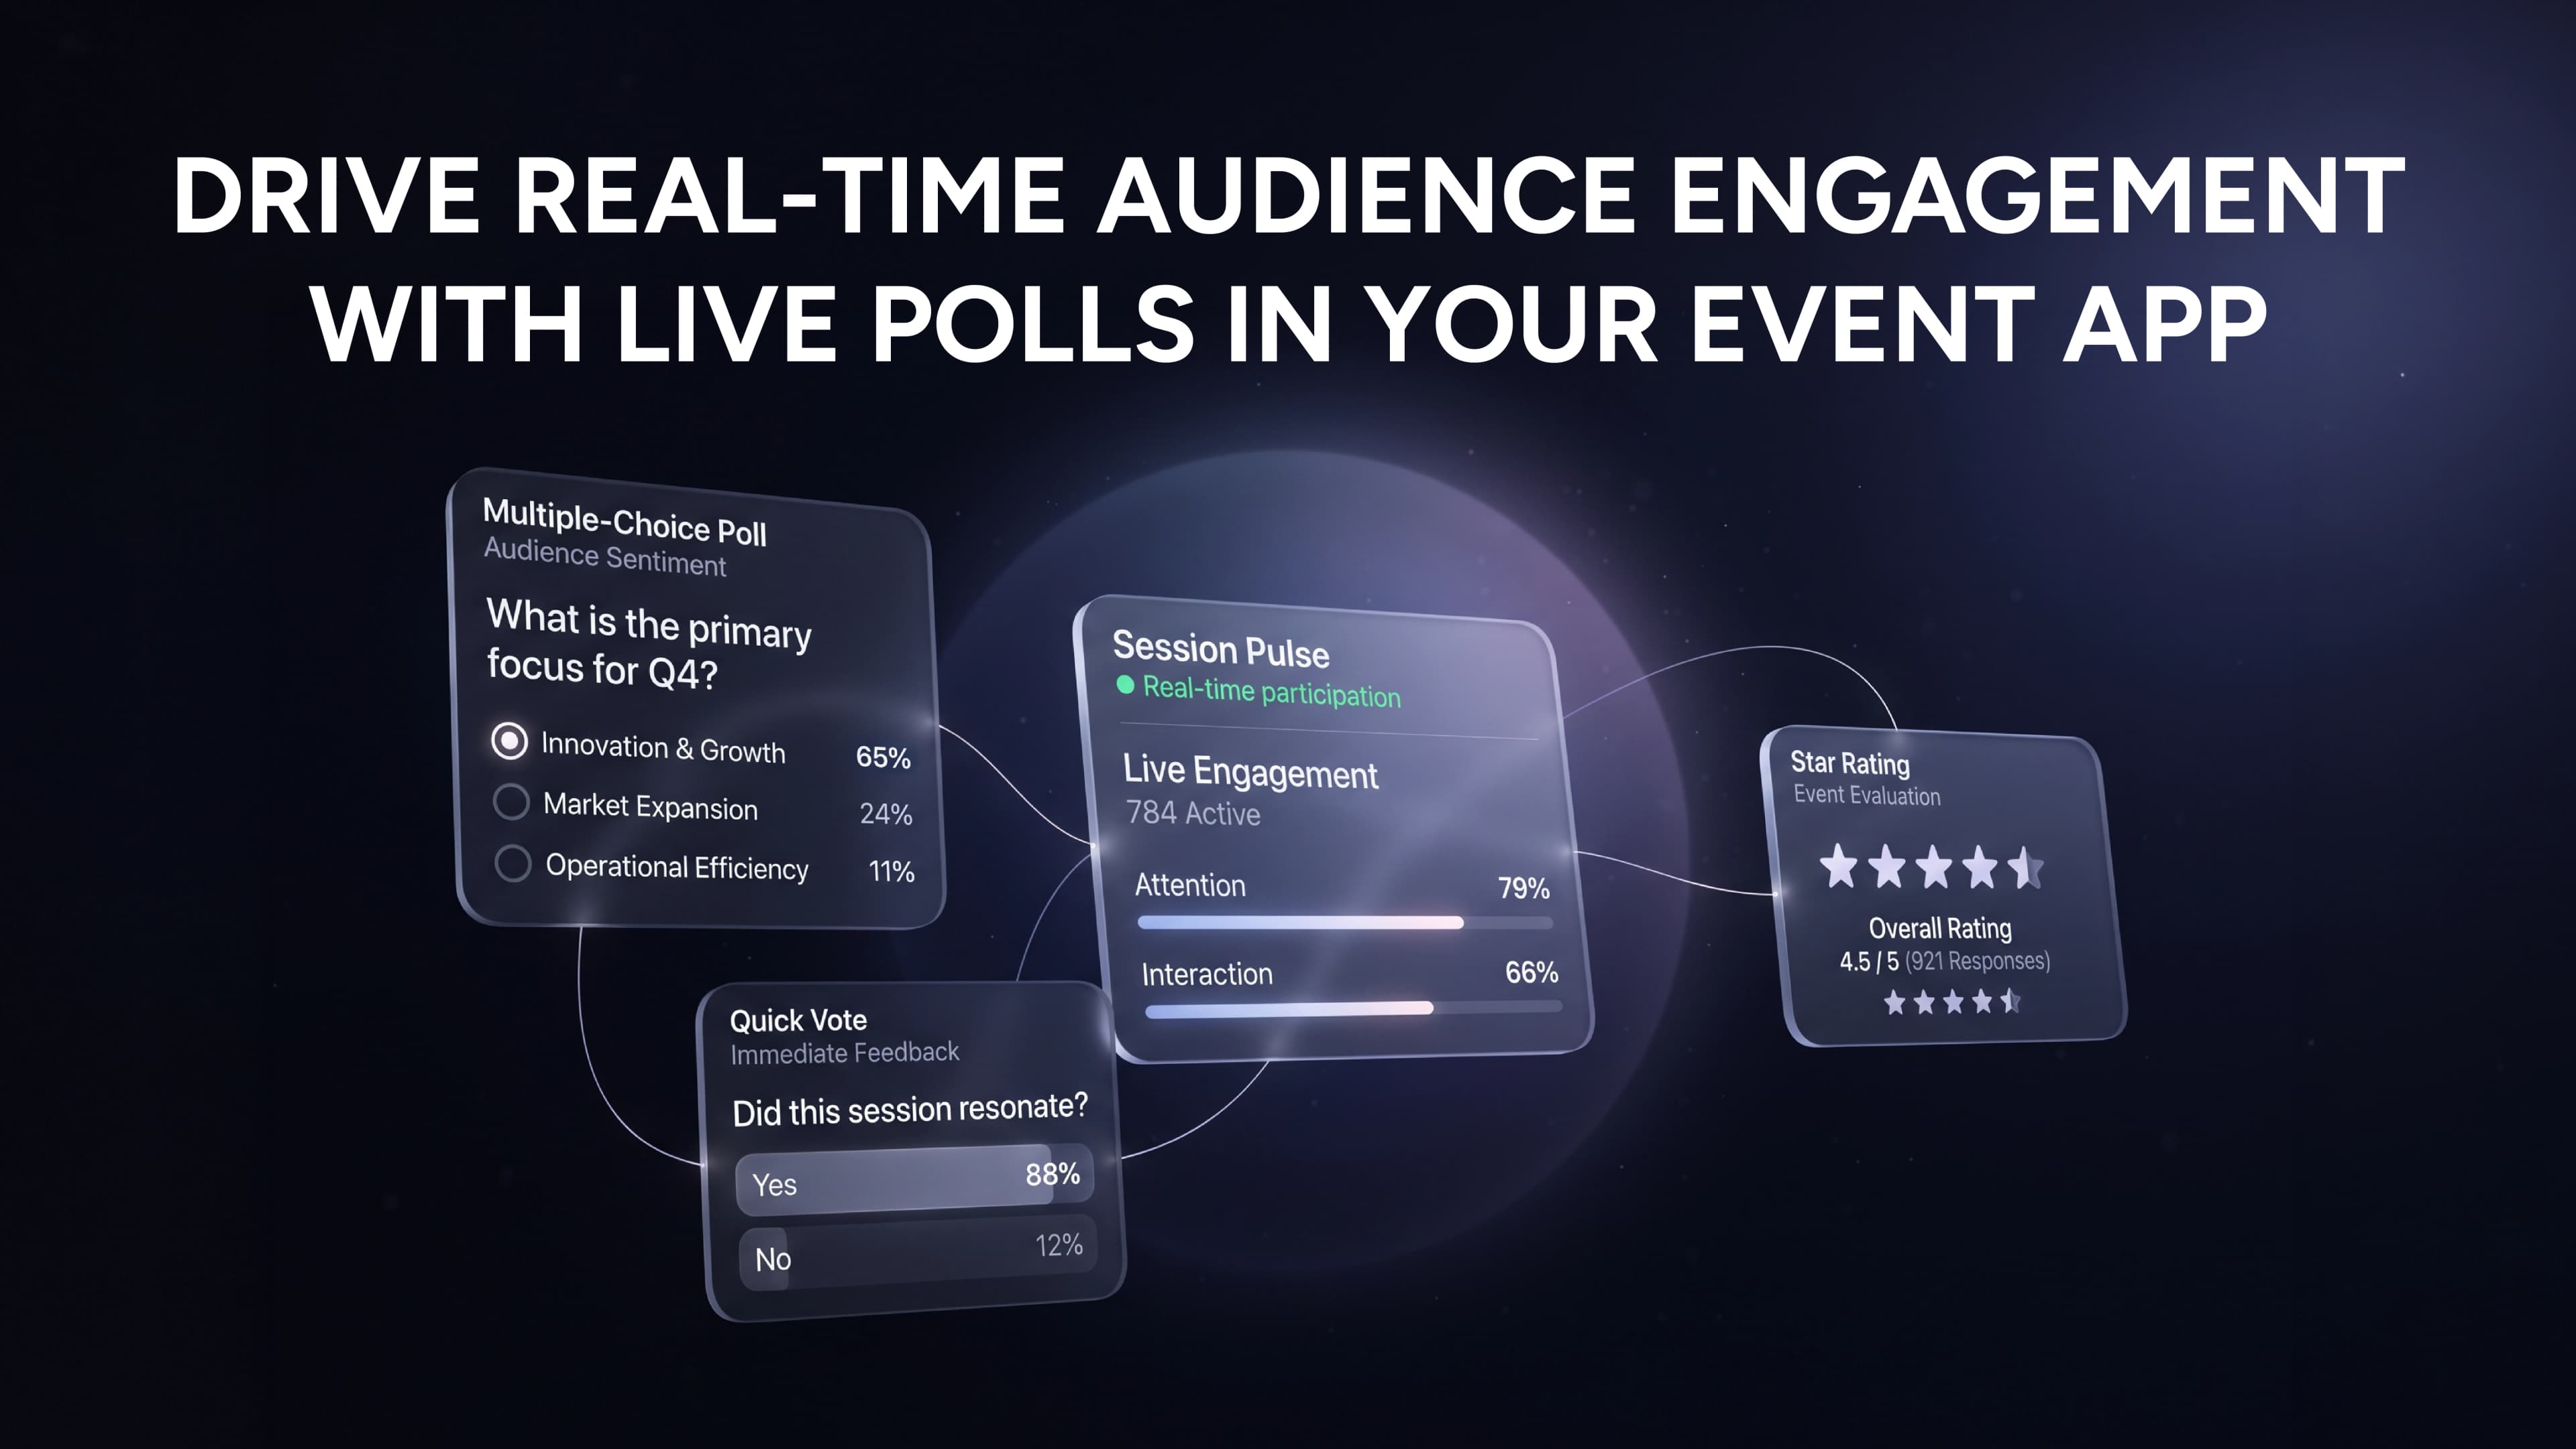
Audience engagement has evolved far beyond raising hands in a crowded conference room. Whether you're organizing a conference, summit, workshop, annual meeting, or virtual event, keeping attendees act
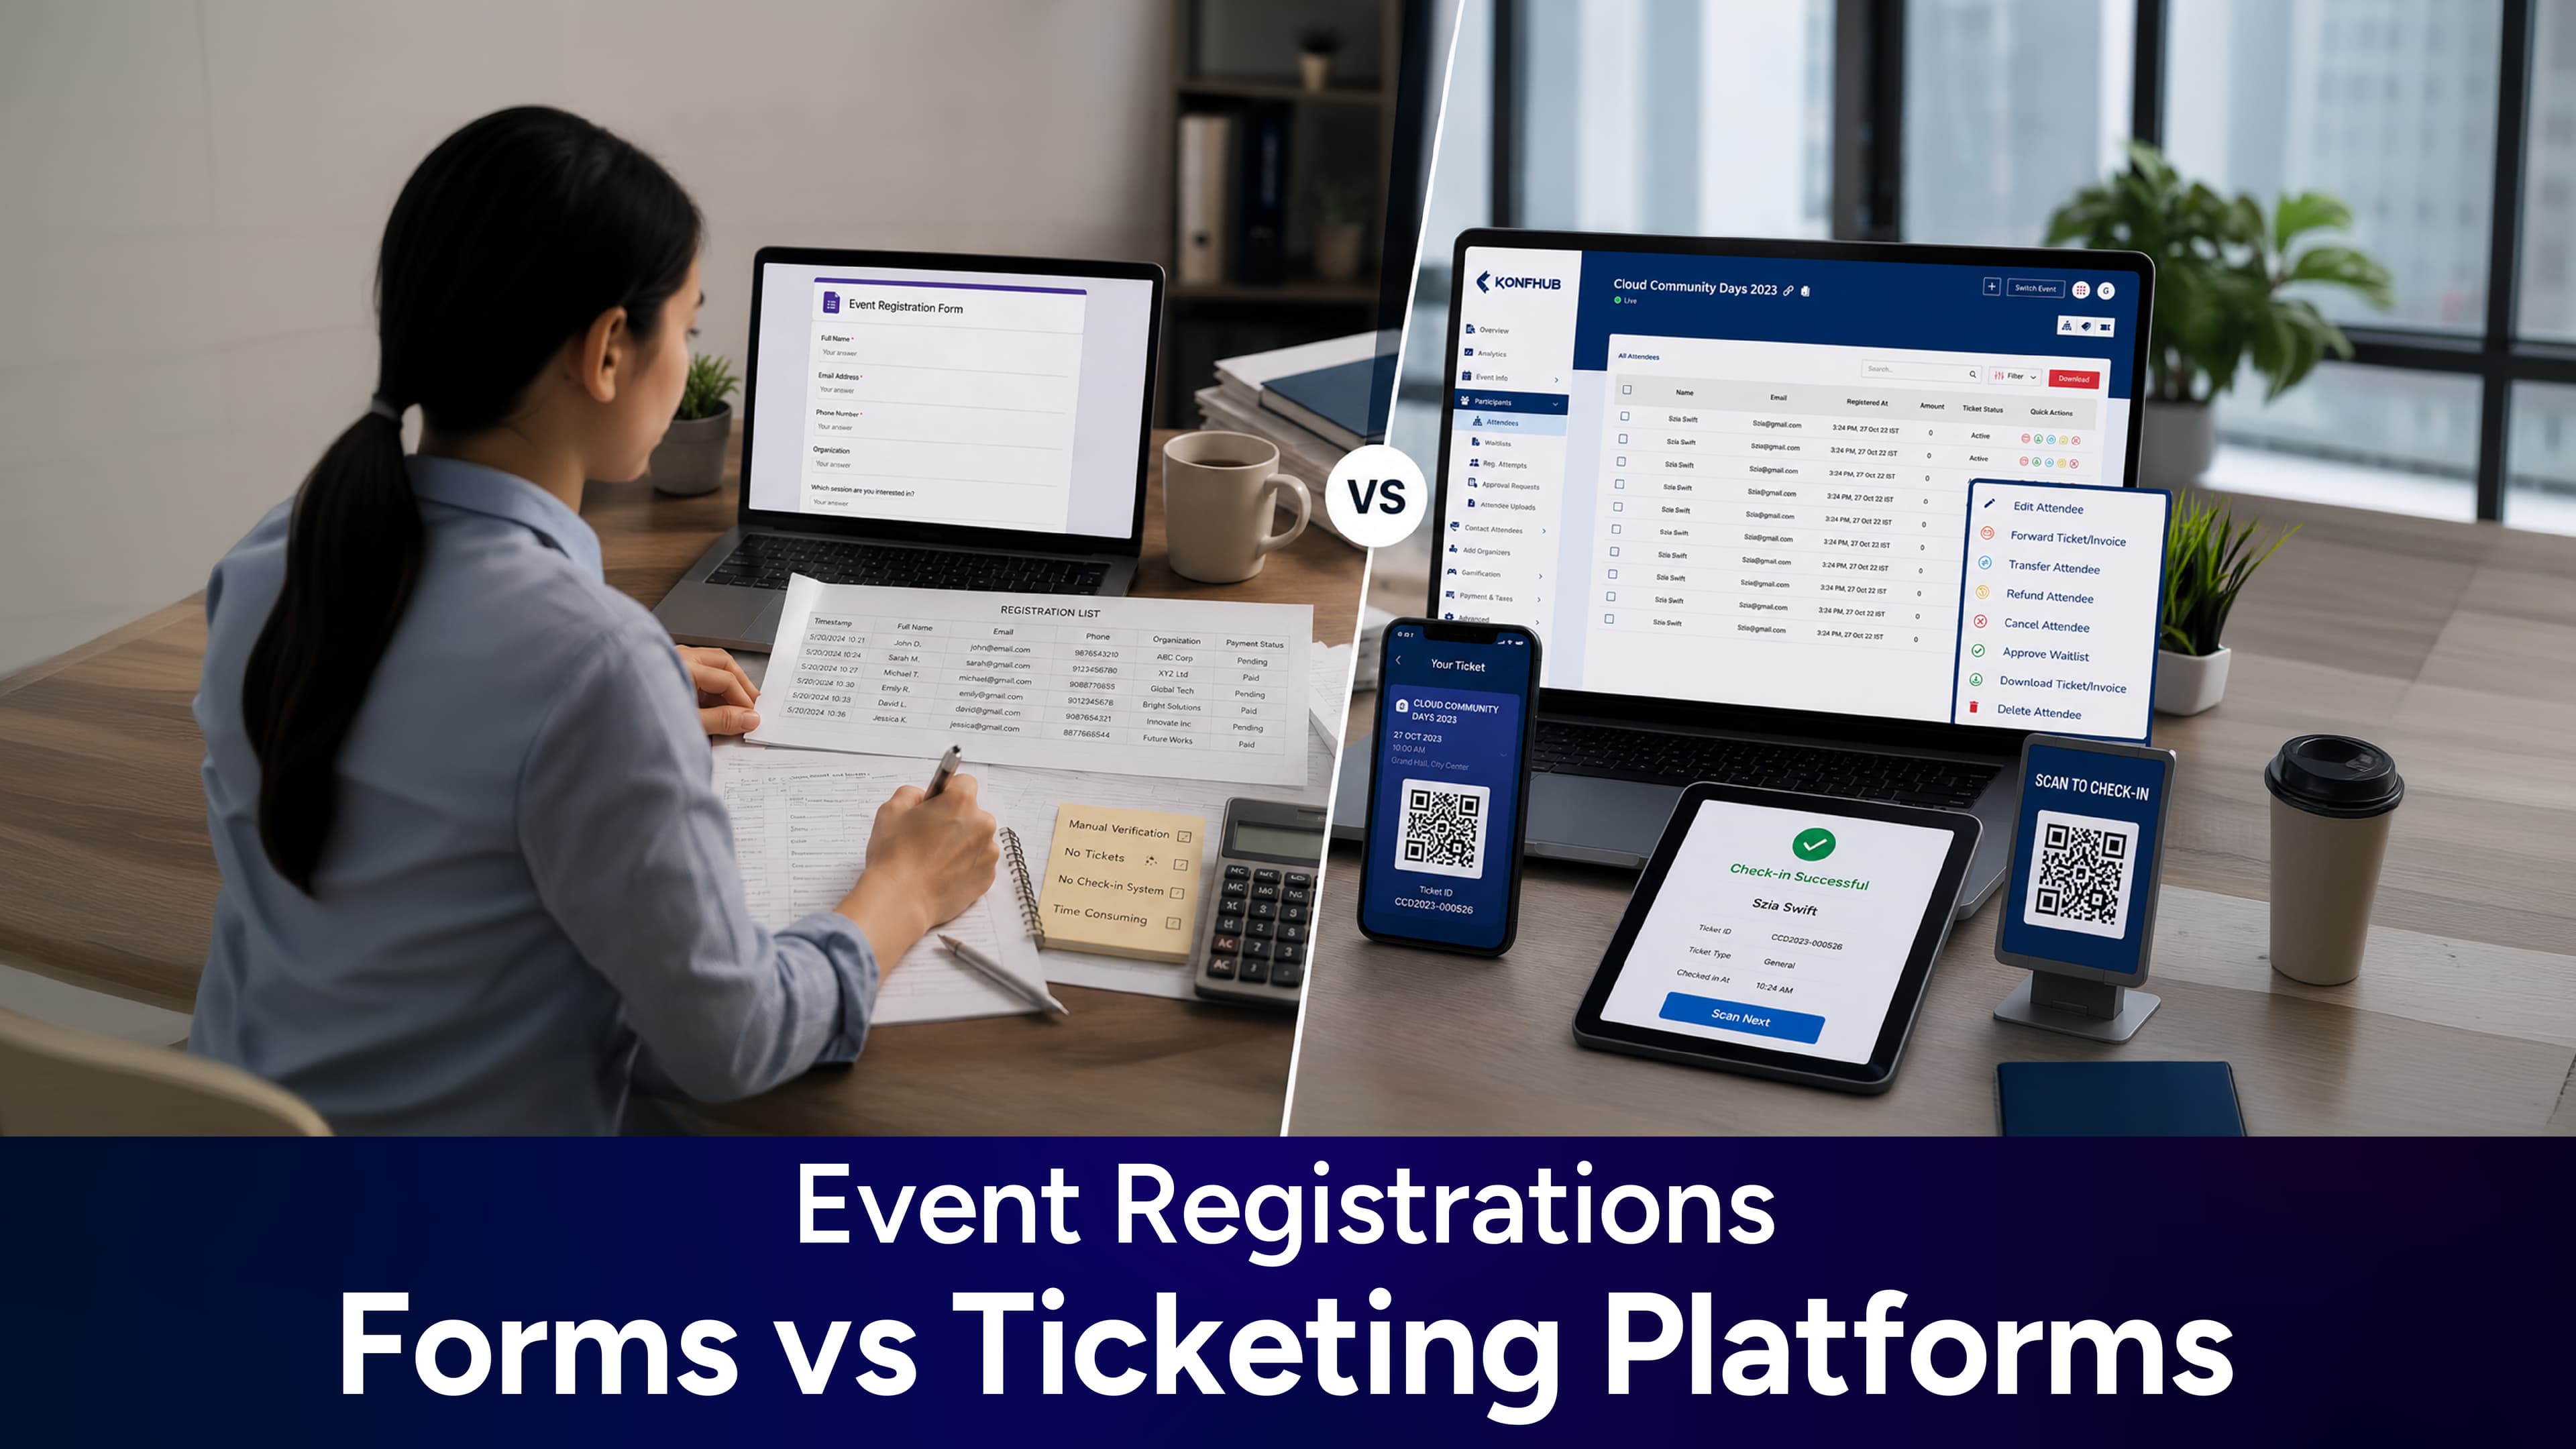
Many event organizers start with Google Forms because it's free, familiar, and easy to set up. While it's a convenient option for collecting registrations for small gatherings, it quickly becomes limi
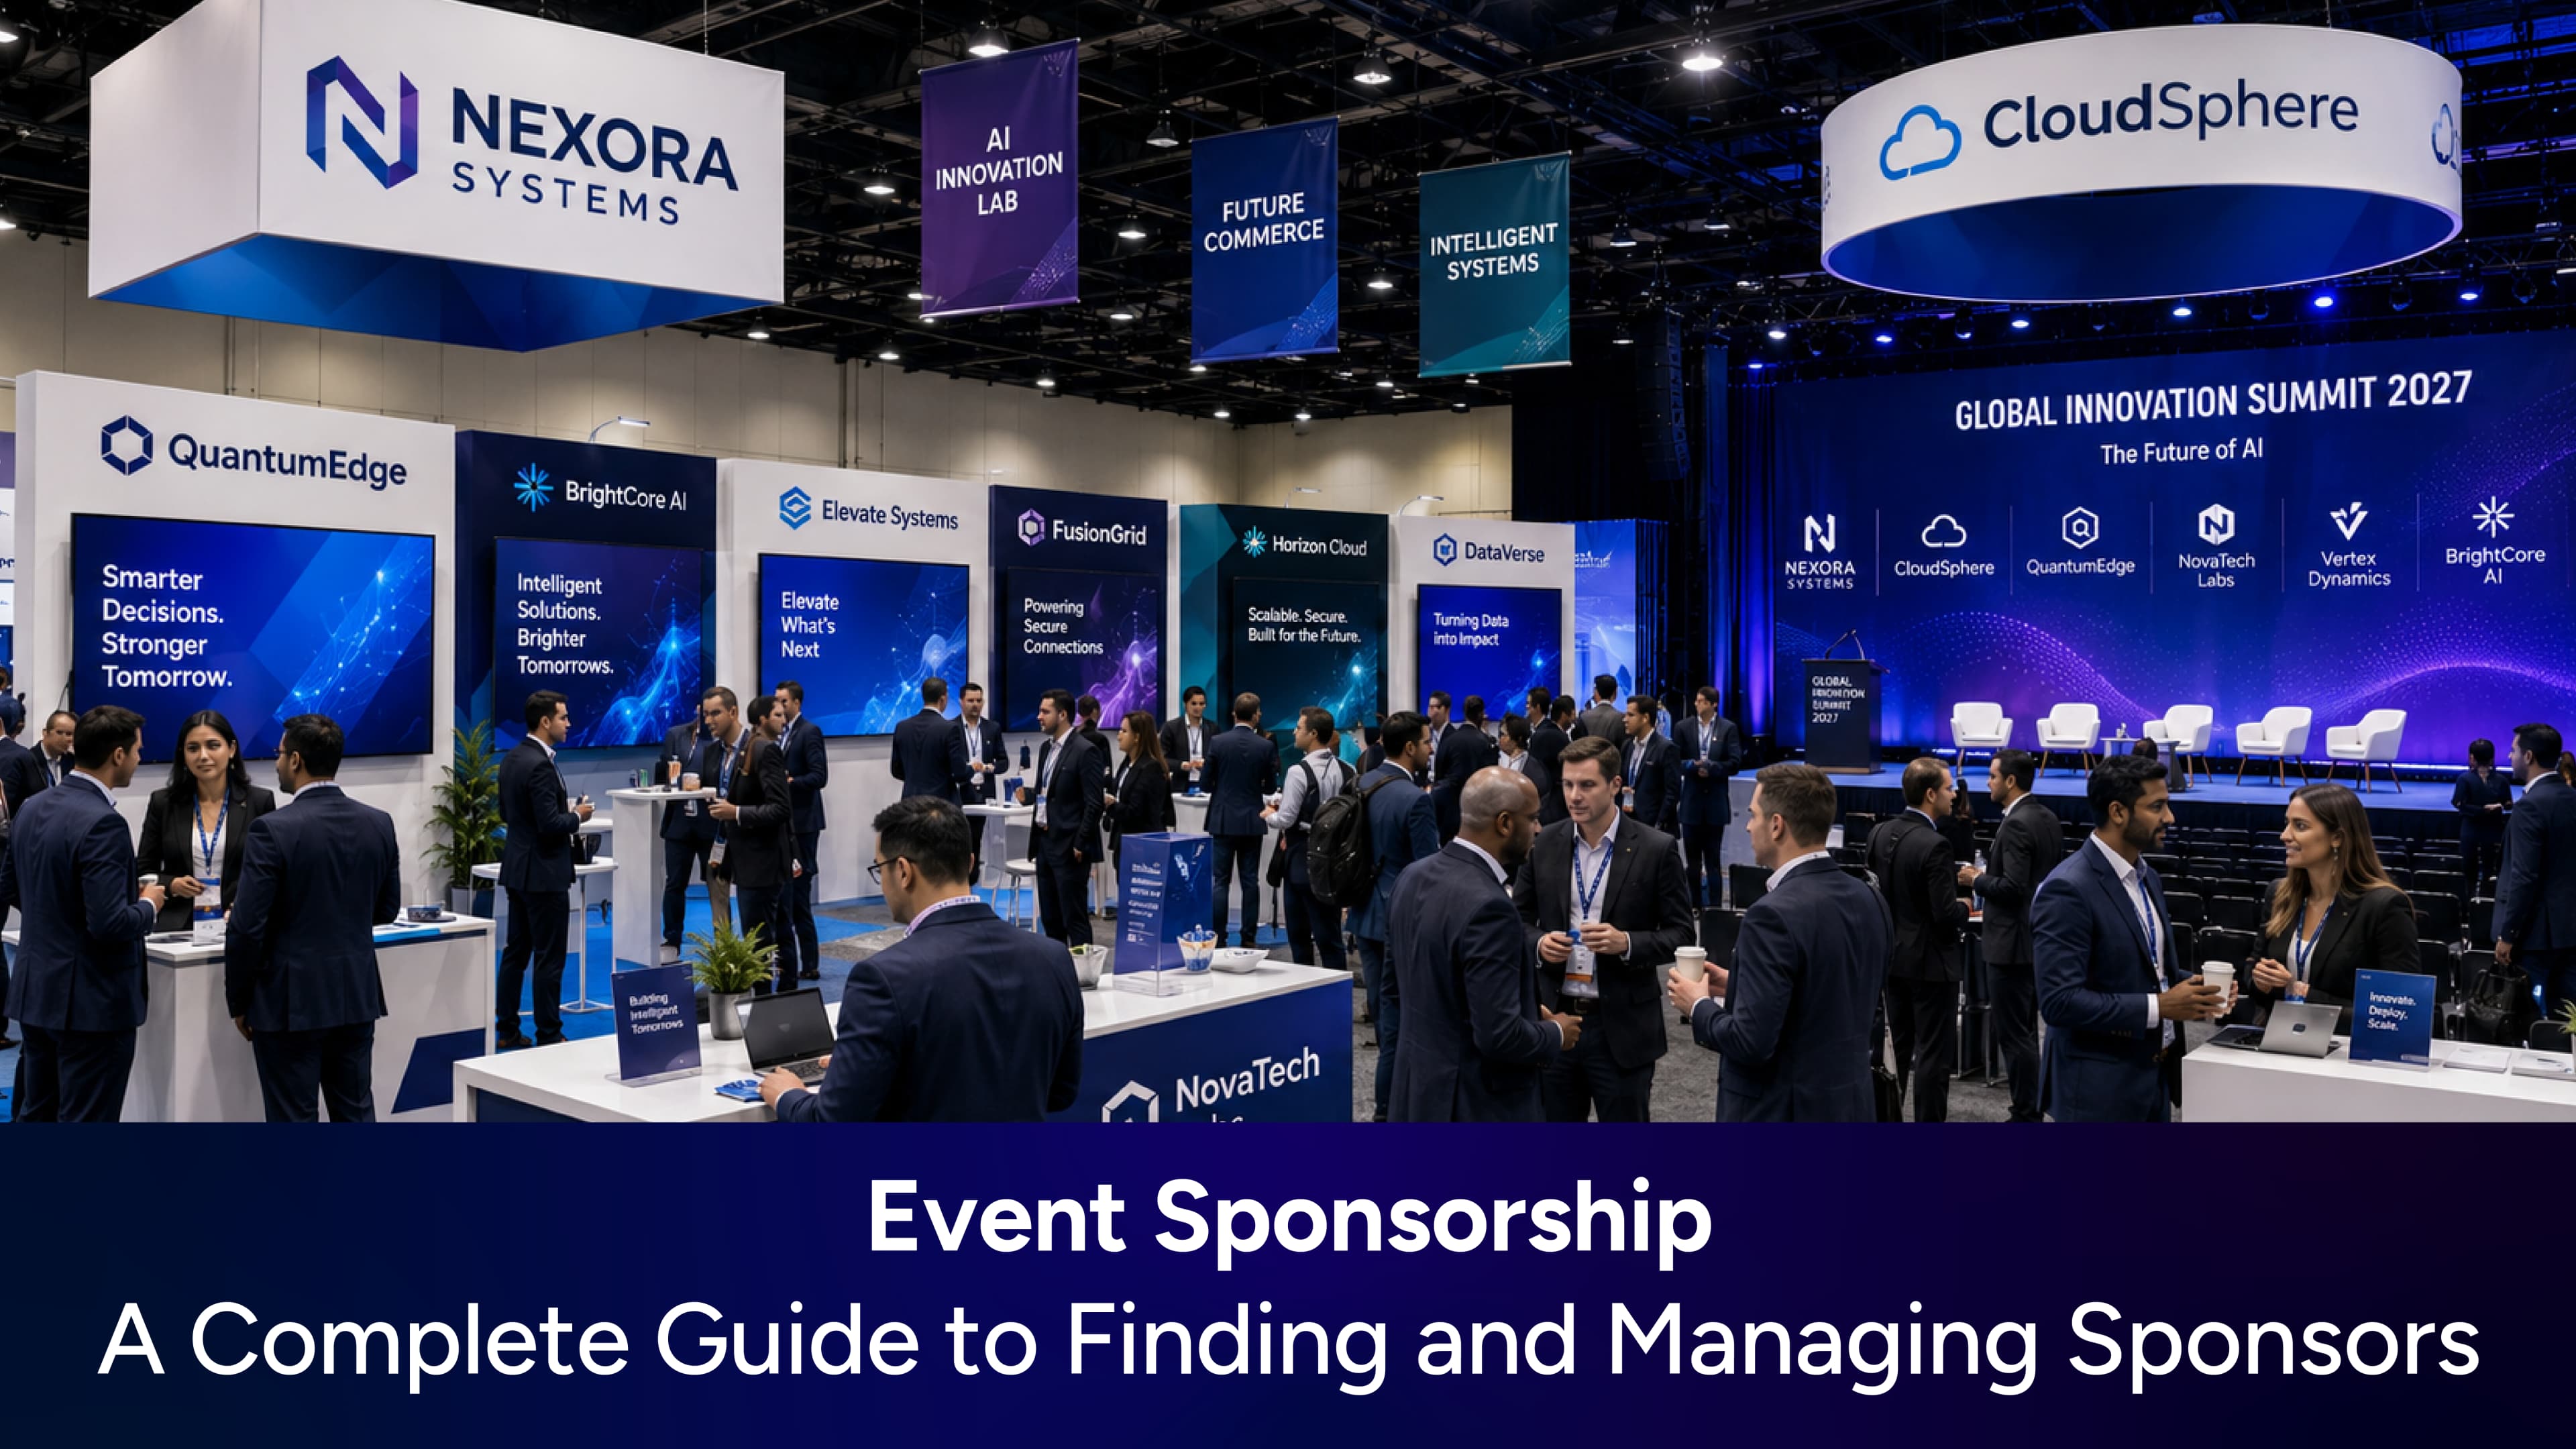
Event sponsorship has evolved far beyond placing a company logo on a stage backdrop. Today's sponsors expect meaningful visibility, measurable business outcomes, and genuine engagement with attendees.
Whether you're organizing a hackathon, debate competition, sports tournament, or corporate event, registering participants as a team is often more efficient than handling individual sign-ups. Traditio
Not every attendee is ready to complete an online payment the moment they register. For corporate teams, educational institutions, government organizations, and large groups, payments often happen thr

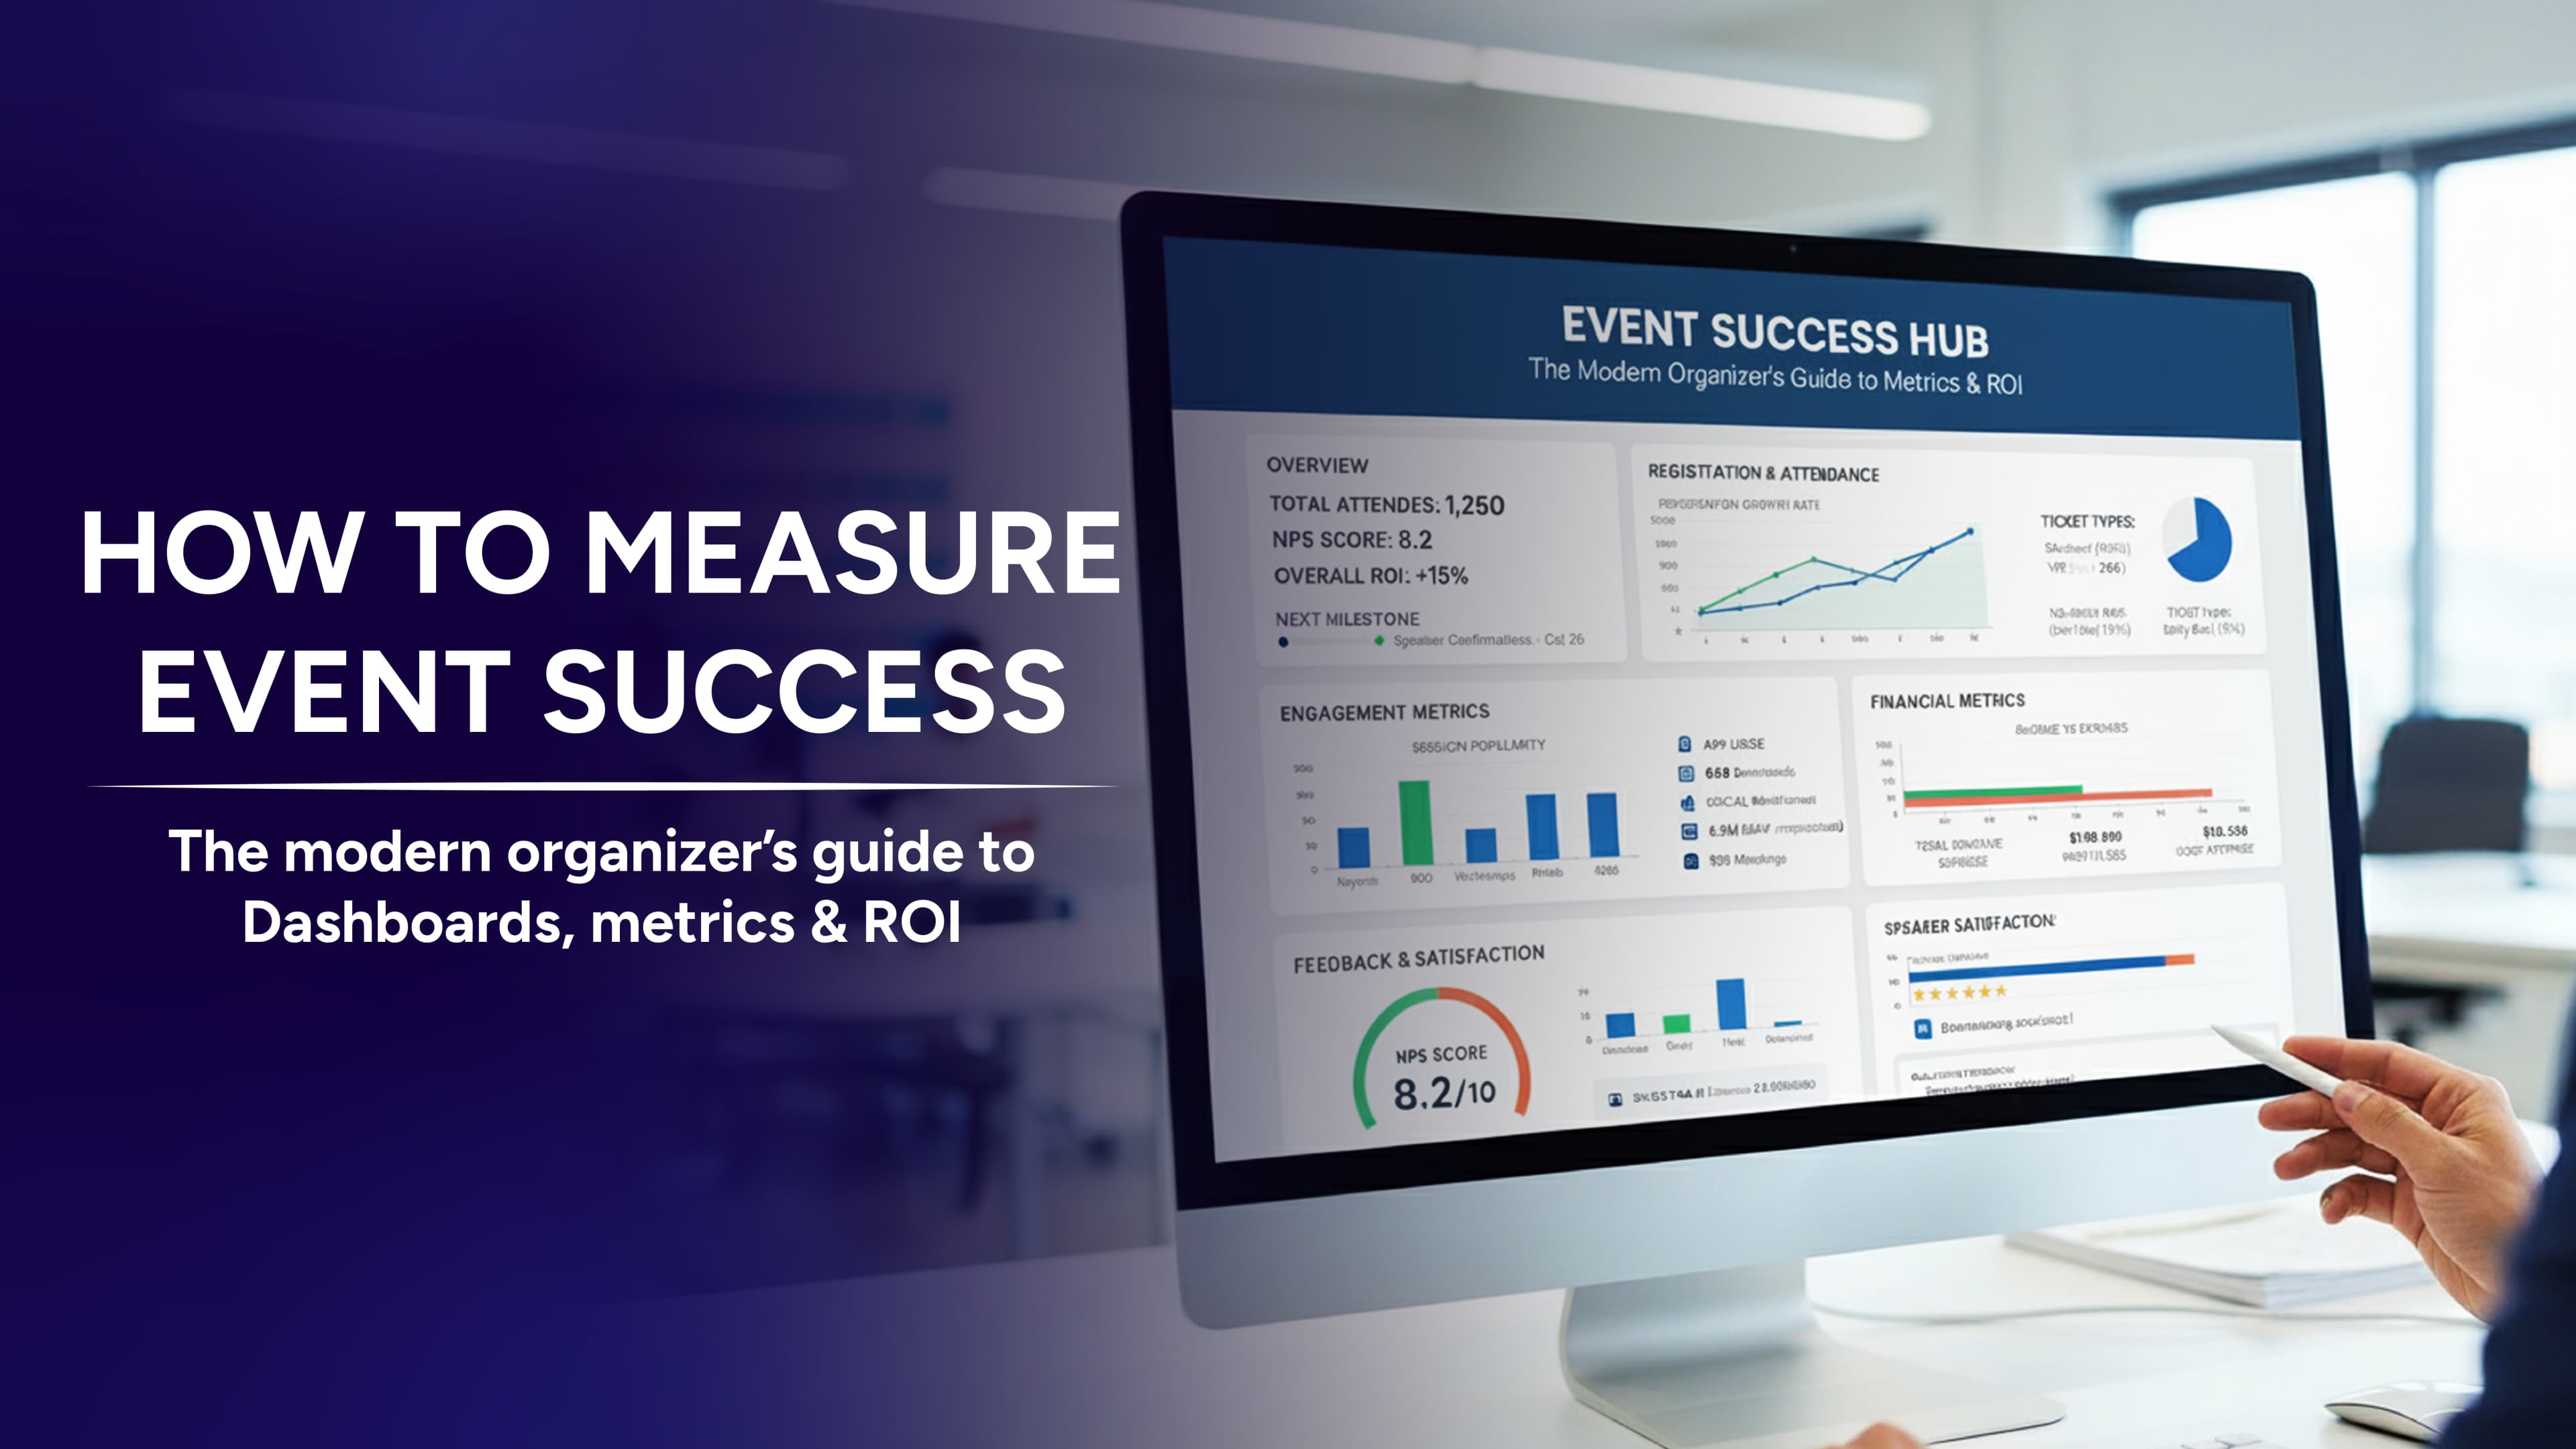
There was a time when a packed venue and positive attendee feedback were enough to consider an event successful. Today, that’s no longer enough. Modern event organizers are expected to prove real business impact using data, analytics, and measurable outcomes.
That’s why understanding how to measure event success has become a critical part of event planning and event marketing. From attendee engagement and registration conversions to sponsor ROI and lead generation, successful events are now evaluated using clear event success metrics and performance data.
Whether you’re hosting a conference, webinar, trade show, or hybrid event, measuring the success of an event helps you understand what worked, what needs improvement, and how effectively your event delivered value to attendees, sponsors, and stakeholders. It also helps improve future event strategy and justify event budgets with measurable ROI.
In this guide, we’ll explore the best ways for measuring event success, including attendee engagement metrics, event ROI measurement, virtual event analytics, and post-event performance tracking. If you’re wondering how to measure the success of an event using real data instead of assumptions, this guide will help you build a smarter event measurement strategy.
Most organizers still measure success the same way they did a decade ago:
Count attendance
Send a survey
Hope for a few nice quotes
The problem?
Attendance shows reach, not impact.
Surveys capture sentiment, not behavior.
In-person, hybrid, or virtual - every event now generates thousands of data points. Real-time dashboards and integrated analytics make it possible to see what’s working while it’s happening, not weeks later.
Event success today is about tying that data back to business outcomes - leads, revenue, loyalty, and community growth.
Before you measure anything, decide what success means for your event.
A few examples:
Product launches: number of qualified leads, press coverage, demo requests
Conferences: attendee engagement, sponsor ROI, content replays
Community events: satisfaction scores, participation rates, new members added
Expos and trade fairs: Connections made, exhibitor footfall & ROI
Create SMART goals to make your success measurable: Specific, Measurable, Achievable, Relevant, Time-bound
Example: “Convert 20% of attendees into qualified leads within 30 days post-event.”
Without this clarity, even the best dashboard will only give you numbers - not direction.

The best event dashboards track both what happened and why it happened.
Here’s what you should measure across categories:
Session attendance & dwell time
Poll and Q&A participation
Networking activity (meetings, messages exchanged)
Registration vs. attendance ratio
Check-in speed & queue length
Real-time crowd movement
Leads generated per source
Conversion rate from attendee → opportunity
Cost per lead and cost per attendee
Post-event NPS
Experience Value Score (EVS)
Feedback on content, logistics, and event flow
Booth visits and badge scans
Engagement time per booth
Leads or meetings generated
When combined, these metrics tell the complete story - reach, engagement, satisfaction, and business impact.
Think of it like this:
Dashboards show behavior - what people did.
Surveys show sentiment - what people felt.
You need both to get the full picture.
Dashboards give you real-time visibility: who checked in, which sessions are performing, where attendees are clustering, and how engagement changes throughout the day.
Surveys, meanwhile, add the human layer - what worked, what didn’t, and how people experienced it.
A simple framework:
Use dashboards to track actions and respond live.
Use surveys to understand outcomes and plan the next one.
Together, they move your events from guesswork to precision.
The smartest organizers don’t wait until after the event to act - they adjust as it unfolds.
Real-time dashboards let you:
Track live attendance by session
See engagement spikes or drop-offs
Identify high-traffic zones
Reallocate staff or push notifications instantly
Let’s say your keynote session is losing attendees mid-way. A quick push notification via your event app could nudge them to rejoin or visit a nearby activation.
With the Konfhub Check-in App, you can monitor arrivals, manage queues, and track attendance in real time - all feeding directly into your analytics dashboard.
The Konfhub Attendee App adds another layer, capturing live polls, chat activity, and micro-feedback - helping you spot what’s resonating right now.
After the event, it’s time to see whether all that buzz turned into results.
Key post-event metrics to track:
ROI formula: (Revenue – Cost) ÷ Cost × 100
Pipeline velocity: How fast leads move from conversation → meeting → deal
Content engagement: Replay views, downloads, and social shares
Survey insights: NPS, top-rated sessions, open-text feedback
For sponsors and exhibitors, measurement goes beyond traffic counts. They want proof of performance.
The Konfhub Exhibitor Portal lets sponsors view their booth analytics, leads captured, and engagement data in one place - giving them tangible ROI insights.
Data trapped in silos is just noise.
When registration data connects to check-in, engagement, CRM, and ROI dashboards - that’s when insights become actionable.
A connected measurement flow looks like this:
Registration: Attendee data captured.
Check-in: Real-time arrival tracking begins.
Engagement: Polls, messages, booth visits logged.
CRM sync: Leads flow directly into sales systems.
Reporting: Dashboards visualize ROI by source.
This end-to-end visibility is how you turn an event into a measurable growth engine.
You’ve got the data. Now make it tell a story.
Tips for dashboard design:
Keep it clean - 8 to10 KPIs max.
Use color-coded indicators for at-a-glance decisions.
Create audience-specific views:
Executives: ROI, attendance, reach
Marketing: engagement, leads
Operations: logistics efficiency
A visual dashboard shortens feedback loops and makes post-event debriefs a breeze.
The point of measuring isn’t just to report - it’s to improve.
Use your event analytics to:
Spot repeat bottlenecks (low dwell time, session overlap).
Refine event design for future editions.
Adjust sponsor packages based on real engagement.
Double down on high-performing content or formats.
With each iteration, your measurement system becomes smarter - and so does your event strategy.
How do you measure event success?
You can measure event success by tracking key event success metrics such as attendee engagement, registrations, attendance rate, lead generation, sponsor ROI, feedback scores, and revenue generated.
What are the best metrics for measuring event success?
The best metrics for measuring event success include attendee satisfaction, event ROI, engagement rate, session participation, networking activity, social media reach, and registration conversion rates.
How do you measure the success of a virtual event?
To measure virtual event success, track metrics like live attendance, watch time, chat participation, poll responses, session engagement, and post-event feedback.
Why is event ROI measurement important?
Event ROI measurement helps organizers understand whether the event achieved business goals such as lead generation, brand awareness, attendee engagement, or revenue growth.
How do you measure event marketing success?
You can measure event marketing success using metrics like ticket sales, website traffic, email open rates, social media engagement, ad conversions, and registration sources.
What is the best way to measure event success after the event ends?
The best way to measure the success of an event after completion is by combining attendee feedback, event analytics, sponsor insights, engagement data, and post-event performance reports to evaluate overall impact.
Modern events can no longer rely on assumptions or surface-level feedback alone. Understanding how to measure event success is essential for improving attendee experience, optimizing event marketing, and proving real business impact.
By tracking the right event success metrics such as attendee engagement, event ROI, registration conversions, sponsor performance, and networking activity, organizers can make smarter decisions backed by data instead of guesswork. Effective measuring event success also helps identify what worked well, what needs improvement, and how future events can deliver even better results.
Whether you’re managing conferences, webinars, hybrid events, or corporate gatherings, combining analytics with attendee feedback gives you a complete picture of event performance. The real value of event measurement is not just knowing that your event succeeded, but understanding exactly why it succeeded.
If you’re looking for an easier way to track registrations, attendee engagement, event analytics, and ROI in one place, explore best event management platform like KonfHub.