

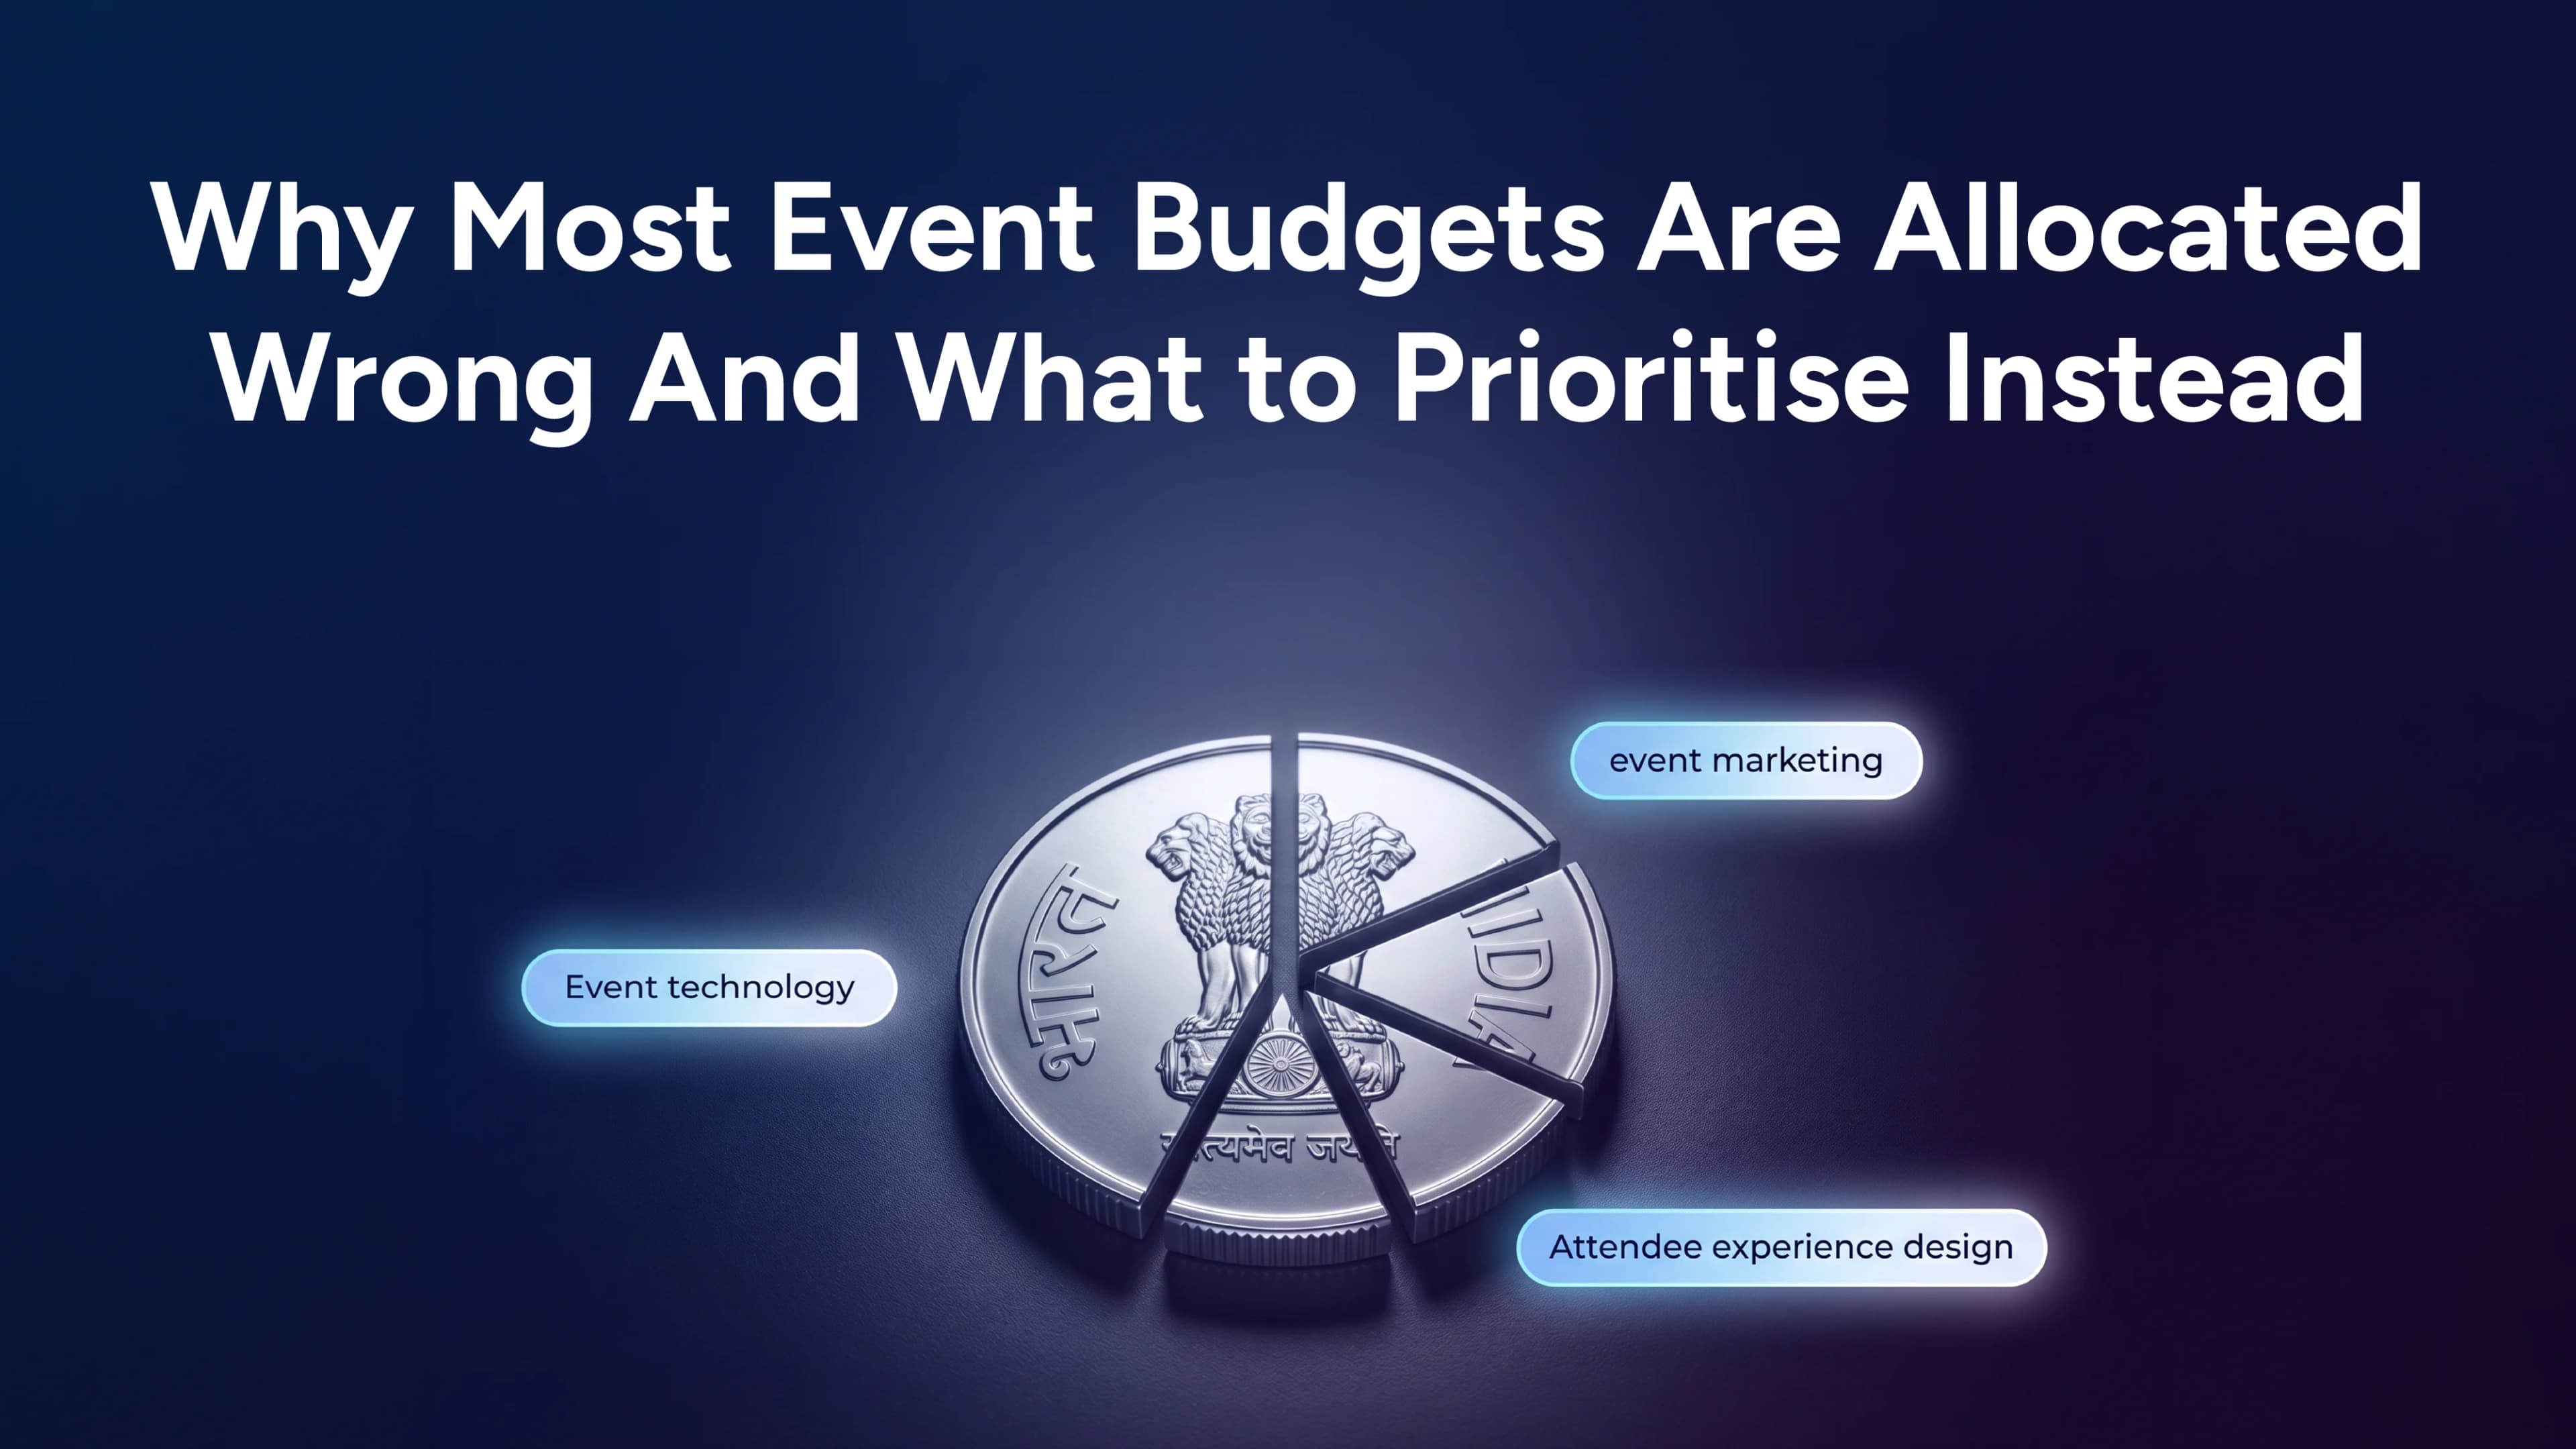
Why Most Event Budgets Are Allocated Wrong (And What to Prioritise Instead)
Ask most event teams to break down where their budget goes and the pattern is remarkably consistent across organisations of different sizes, in different industries, running events of different scales. Venue takes the largest share. Catering and hospitality take a substantial portion. Audio-visual and production costs consume another meaningful chunk. What remains, after those three categories have been satisfied, gets distributed across everything else: the technology that manages the attendee experience, the marketing that drives registrations, the speaker programme that gives the event its credibility, and the post-event activity that determines whether any of it translates into commercial outcomes.
This allocation pattern is not the result of deliberate strategy. It is the result of how event budgets tend to be built: starting from the most visible and most expected costs, satisfying those first, and distributing whatever remains across everything else. The problem is that the most visible costs are not the ones with the strongest connection to the commercial outcomes most B2B event programmes are designed to produce. Understanding where that gap is, and what a reframed allocation looks like in practice, is what this piece is about.
Where most event budgets go wrong
The bias toward venue, catering, and production in event budget allocation is understandable when you consider how these decisions get made. Venue costs are typically the first commitment required, often months before the event, and they anchor the rest of the budget. Catering is a category where cutting visibly affects the attendee experience in ways that are immediately apparent to everyone in the room. Production and AV costs tend to be presented as a package by suppliers, and the gap between a basic and a premium setup feels significant when you are standing in the room making the decision.
The categories that tend to get underfunded, event technology, pre- and post-event marketing, speaker activation, and attendee experience design, share a common characteristic: their impact is less immediately visible and more difficult to attribute directly to specific line items. An attendee who has a poor check-in experience, misses a relevant session because they did not receive a notification, or fails to make a useful connection at the event does not attribute any of those outcomes to a technology budget that was cut to cover a venue upgrade. But the cumulative effect on attendee satisfaction, sponsor confidence, and commercial pipeline is real and measurable over time.
There is also a stakeholder dynamic at play. Event budgets are frequently reviewed by people who attended the event as guests rather than as organisers, and whose impressions are shaped by the venue, the food, and the production quality rather than by the efficiency of the check-in flow or the quality of the post-event analytics. Budget decisions made in response to that feedback tend to reinforce the pattern rather than challenge it.
The difference between visible spend and high-return spend
The most useful reframe for thinking about event budget allocation is the distinction between spend that is visible and spend that drives commercial outcomes. These two categories overlap more than most budget processes acknowledge, but they are not the same thing, and treating them as equivalent is where most allocation decisions go wrong.
Venue quality is visible and it matters, but only up to a functional threshold. A venue that is well-located, accessible, professionally managed, and comfortable for the number of attendees it is hosting satisfies everything the event needs from a venue. Spending significantly beyond that threshold, on a more prestigious address, a more elaborate interior, or a more expansive footprint than the event requires, generates marginal improvements in attendee perception that rarely translate into improved commercial outcomes. The same principle applies to catering and production. Quality matters. Premium beyond a functional standard rarely moves the needle on the metrics that determine whether the event programme is worth running.
The categories that most consistently drive commercial outcomes, lead quality, sponsor renewal, pipeline contribution, and repeat attendance, are the ones that shape the attendee experience throughout the event rather than at the moment of arrival. Event technology determines whether check-in is frictionless or chaotic, whether attendees receive relevant information at the right moment, whether networking is facilitated or left to chance, and whether post-event analytics give sponsors and leadership a credible picture of what happened. Pre- and post-event marketing determines whether the event reaches the right people before it opens and whether the value created inside the room continues to compound after it closes. Speaker programme investment determines the credibility and reach of the event in its target market. These are the categories where additional investment most reliably improves the outcomes that justify running the event in the first place.
The table below illustrates the typical allocation pattern against a reframed one, with the reasoning behind each shift.
Budget Category | Typical Allocation | Reframed Allocation | Why the Shift |
Venue | 25–35% | 15–20% | Venue quality matters, but premium beyond a functional threshold rarely improves commercial outcomes. |
Catering and hospitality | 20–25% | 15–18% | Good food matters for attendee experience. Exceptional food rarely changes whether someone returns or converts. |
AV and production | 15–20% | 8–12% | Production value beyond a professional baseline has diminishing returns for most B2B events. |
Event technology | 3–6% | 10–15% | Registration, check-in, attendee app, analytics, and networking tools directly affect every attendee’s experience and every sponsor’s ROI. |
Speaker programme | 5–10% | 10–15% | Speakers drive registrations, credibility, and post-event content. Under-investing here undercuts the programme’s commercial reach. |
Pre- and post-event marketing | 5–8% | 12–18% | Most of the commercial value of an event is created before and after it. Allocating accordingly reflects where the ROI actually comes from. |
Attendee experience design | 2–4% | 6–10% | Networking design, wayfinding, and content curation determine whether attendees leave with what they came for. |
Swag and branded materials | 5–8% | 2–3% | Swag is rarely a reason someone attends or returns. It is one of the safer places to cut without affecting outcomes. |
Contingency | 3–5% | 5–7% | Most programmes under-budget for contingency. Increasing this reduces the pressure that drives last-minute cuts in the wrong places. |
The budget categories worth investing in more than most programmes do
Event technology
The case for investing more in event technology than most budgets currently allow is straightforward when you consider what it actually covers. Registration and ticketing determine the first impression the event makes and the quality of the data available for every downstream decision. Check-in infrastructure determines whether the first five minutes of the attendee experience are smooth or frustrating. An attendee app with integrated agenda, networking, and notification tools determines whether attendees navigate the event effectively or drift through it. Post-event analytics determine whether sponsors receive a credible account of what happened or a thin report that makes renewal conversations difficult. These are not peripheral functions. They are the operational backbone of the event, and under-investing in them has a compounding effect on every other line item in the budget. The piece on what a fragmented event tech stack actually costs covers this in detail for teams that want to understand the full picture.
Pre- and post-event marketing
Most of the commercial value of a B2B event is created before and after it, not during it. Pre-event marketing determines the quality of the audience that shows up, which determines the quality of every conversation, every lead, and every sponsor interaction that happens on the day. Post-event marketing determines whether the ideas, content, and relationships generated during the event continue to compound or quietly disappear. Allocating a combined 12 to 18 percent of the event budget to these two phases reflects where the return actually comes from, and it is one of the most consistent reallocation opportunities available to event programmes that are currently over-indexed on day-of production costs.
Speaker programme
Speakers drive registrations, establish the event’s credibility in its target market, generate reusable content assets, and contribute reach through their own networks that the organizer cannot replicate through paid channels. Under-investing in the speaker programme, whether by limiting the budget for speaker fees, failing to invest in speaker briefing and activation, or treating speaker content capture as an afterthought, undercuts the commercial value of the event in ways that are difficult to recover from on the day. The piece on turning event speakers into a marketing asset covers the full picture of what speaker investment can return when it is managed deliberately.
Attendee experience design
Attendee experience design is one of the most underfunded categories in most event budgets, partly because it is not a single line item with a clear supplier and partly because its impact is diffuse rather than concentrated in a single visible moment. It covers the networking facilitation, the wayfinding, the session flow, the transitions between programme elements, and the overall rhythm of the day that determines whether attendees feel the event respected their time and delivered what it promised. Events that invest deliberately in this layer consistently produce higher return attendance rates and stronger word-of-mouth than those that treat it as something that will sort itself out on the day.
The budget categories most programmes overspend on relative to return
This is not an argument for cutting costs indiscriminately. It is an argument for understanding where the return on spend diminishes quickly relative to the alternatives.
Venue premium beyond a functional threshold is the category where overspend is most common and most consequential, because venue costs anchor the rest of the budget. A venue that is clean, well-located, professionally managed, and appropriately sized for the event satisfies every functional requirement. The additional spend required to upgrade to a more prestigious address or a more elaborate interior is rarely reflected in better commercial outcomes, and it tends to crowd out investment in the categories that would actually improve them.
Production and AV costs follow a similar pattern. Professional-quality sound, lighting, and recording are worth investing in because they affect the experience of every attendee and the quality of any content captured for post-event use. Elaborate staging, complex lighting rigs, and high-end visual production beyond what the event’s content and format actually require are where the return diminishes quickly. For most B2B conferences, the investment in making the content excellent and the speaker programme strong will produce better outcomes than an equivalent investment in making the stage look more impressive.
Swag and branded materials occupy the clearest case for reduction. Branded merchandise is rarely a reason someone attends an event, rarely affects whether they return, and rarely influences whether a sponsor renews. It is a category where cutting to two or three percent of the budget, focused on a small number of genuinely useful or distinctive items rather than a large volume of generic ones, frees up meaningful resources for higher-return categories without any measurable impact on outcomes.

A framework for building your event budget from outcomes, not line items
The most durable fix to event budget misallocation is changing the process by which the budget is built. Most event budgets are constructed by starting with line items and assigning percentages. A more effective approach starts with commercial goals and works backward to the activities that serve them, then allocates budget to activities rather than categories.
The framework below maps common commercial goals to the activities and budget categories most likely to serve them. It is not a prescription for every event but a starting point for a more intentional conversation about where the money should go.
Commercial Goal | Activities That Serve It | Budget Categories to Prioritise | Categories to Scale Back |
Generate qualified pipeline | Audience curation, speaker credibility, networking design, post-event follow-up | Speaker programme, attendee experience, pre-event marketing, event technology | Production excess, swag, venue premium beyond functional threshold |
Retain and grow sponsors | Exhibitor tools, lead capture quality, post-event reporting, sponsor visibility | Event technology, post-event marketing, attendee experience | Generic branded materials, underused AV features |
Build market credibility | Speaker quality, content depth, pre-event thought leadership, post-event content | Speaker programme, pre- and post-event marketing, content capture | Swag, excess production, catering above functional standard |
Drive repeat attendance | Attendee experience quality, networking value, programme relevance | Attendee experience design, event technology, speaker programme | One-time brand moments with no lasting value, excess hospitality |
Generate reusable content | Content capture, speaker activation, post-event distribution | Speaker programme, pre- and post-event marketing, content capture infrastructure | AV production beyond recording quality, physical brand installations |
Applying this framework in practice means beginning the budget process with a clear articulation of what the event is designed to achieve commercially, then building the allocation around the activities that most directly serve those goals. Categories that do not serve any of the stated goals should be questioned rather than assumed.
A worked example: mid-sized B2B conference, £60,000 budget
The table below shows how a £60,000 budget for a mid-sized B2B conference of 200 to 300 attendees might look under a typical allocation versus a reframed one. The total spend is identical. The distribution reflects a deliberate shift toward the categories with the strongest connection to commercial outcomes.
Budget Category | Typical Allocation | Reframed Allocation | Difference |
Venue | £18,000 (30%) | £12,000 (20%) | -£6,000 |
Catering and hospitality | £15,000 (25%) | £10,800 (18%) | -£4,200 |
AV and production | £10,800 (18%) | £7,200 (12%) | -£3,600 |
Event technology | £2,400 (4%) | £7,800 (13%) | +£5,400 |
Speaker programme | £4,200 (7%) | £7,800 (13%) | +£3,600 |
Pre- and post-event marketing | £3,600 (6%) | £8,400 (14%) | +£4,800 |
Attendee experience design | £1,800 (3%) | £4,200 (7%) | +£2,400 |
Swag and branded materials | £3,600 (6%) | £1,200 (2%) | -£2,400 |
Contingency | £0,600 (1%) | £0,600 (1%) | No change |
Total | £60,000 (100%) | £60,000 (100%) | Same budget, different outcomes |
The reframed budget does not produce a worse event. It produces a different set of priorities: a venue that is functional and well-located rather than prestigious, production quality that is professional without being elaborate, and a meaningful increase in the investment going toward technology, marketing, speakers, and attendee experience. These are the categories where additional spend is most likely to produce better leads, stronger sponsor relationships, and higher return attendance.
How to make the case for reallocation internally
For the organizer or marketing manager who recognises the pattern described here but needs to make the case for a different allocation to a stakeholder who controls the budget, the challenge is often one of metrics rather than argument. Decision-makers who are used to evaluating events by attendance numbers, venue quality, and immediate attendee feedback are not wrong to care about those things. They need a reason to weight other metrics more heavily.
The most effective approach is to agree on a richer set of success metrics before the event rather than after it. If the conversation about what success looks like happens before the budget is finalised, it creates the conditions for a budget allocation conversation that is grounded in outcomes rather than precedent. Metrics like lead quality scores, sponsor renewal rates, post-event pipeline contribution, and return attendance rates are more difficult to dismiss than attendance numbers when they have been agreed upfront as the relevant measures of success.
It also helps to make the connection between budget categories and outcomes explicit rather than assumed. Presenting the reallocation as a hypothesis, invested in technology and speaker activation produces better leads and higher sponsor renewal than equivalent spend on venue premium, and proposing a single event as a test of that hypothesis, gives a risk-averse stakeholder a manageable way to engage with the argument without committing to a permanent change.
For teams building the commercial case for events more broadly, the piece on why events should be at the center of your GTM strategy provides the wider context in which budget allocation decisions sit. The argument for investing more in event technology, marketing, and attendee experience is strongest when it is connected to a clear view of how events contribute to pipeline and revenue rather than treated as a standalone operational question.
Closing thoughts
Event budget allocation is one of those decisions that compounds quietly over time. An allocation that consistently over-invests in visible costs and under-invests in the categories that drive commercial outcomes produces events that look good on the day and underperform on every metric that matters afterward. Correcting this does not require a larger budget. It requires a more deliberate process for deciding where the existing budget goes.
The framework offered here is a starting point rather than a formula. Every event programme has a different commercial context, a different audience, and a different set of goals, and the right allocation will vary accordingly. What tends to be consistent across programmes of different types and sizes is the direction of the shift: toward technology, marketing, speakers, and experience design, and away from venue premium, production excess, and swag. Getting that direction right is what separates event programmes that grow in commercial value over time from those that plateau despite increasing their budget.
If you are evaluating where your current event technology spend is going and what it is actually returning, Konfhub’s event management platform covers the full event lifecycle in a single connected system, which gives you a useful reference point for what consolidated, well-integrated technology investment looks like in practice.
Frequently asked questions
What percentage of an event budget should go to venue costs?
Most event professionals recommend keeping venue costs between 15 and 25 percent of the total budget for a B2B conference. The right number depends on the event’s goals, location, and audience, but the principle is to invest enough to secure a venue that is functional, accessible, and appropriate for the event’s professional context, without allowing venue prestige to crowd out investment in the categories that more directly drive commercial outcomes.
How much should a B2B event budget allocate to technology?
Most B2B conference budgets currently allocate between three and six percent to event technology, which is significantly below what the category’s impact on attendee experience, sponsor satisfaction, and post-event analytics warrants. A reframed allocation of 10 to 15 percent, covering registration, check-in, attendee app, networking tools, and analytics, reflects the technology’s role as the operational backbone of the event rather than a peripheral addition to it.
Is it worth cutting swag from an event budget?
Reducing swag spend to two or three percent of the total budget, focused on a small number of genuinely useful or distinctive items, is one of the safer cuts available to most event programmes. Swag is rarely a reason someone attends, rarely affects whether they return, and rarely influences sponsor renewal decisions. The resources freed up by reducing it are more productively deployed in attendee experience, technology, or post-event marketing.
How do you justify higher event technology spend to internal stakeholders?
The most effective approach is to connect technology investment to specific commercial outcomes that stakeholders already care about: lead quality, sponsor renewal rates, and post-event pipeline contribution. Framing technology as the infrastructure that makes those outcomes measurable and improvable, rather than as a cost in its own right, tends to land better than arguing for it on operational grounds alone. A single event where improved technology investment is tracked against specific outcome metrics gives stakeholders the evidence they need to support the allocation in future editions.
Should pre-event marketing be treated as part of the event budget?
Yes, and post-event marketing should be as well. Most of the commercial value of a B2B event is created before and after it rather than during it, and treating pre- and post-event marketing as separate line items outside the event budget tends to result in both being underfunded. A combined allocation of 12 to 18 percent of the total event budget for pre- and post-event marketing reflects where the return actually comes from and makes the full cost of producing that return visible in the budget rather than hidden across separate departmental budgets.